Tag Archive: Price action


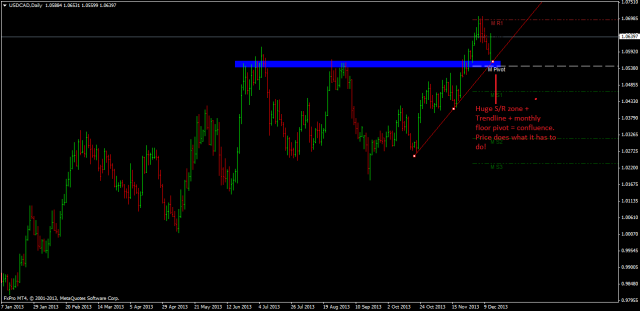
USD/CAD – Confluence trading is one of the most reliable and high rewarding type of trading and most of the veterans only do confluence trading.

usdcaddaily

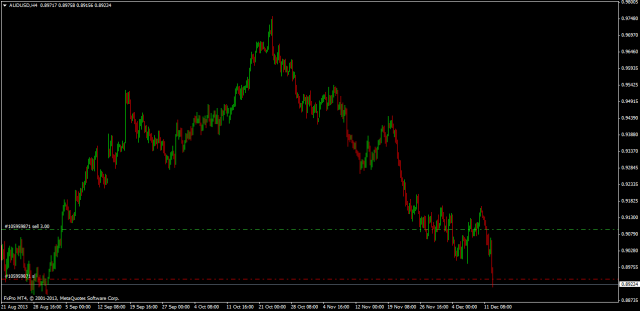
Aussie/Dollar – Great day.

audusdh4

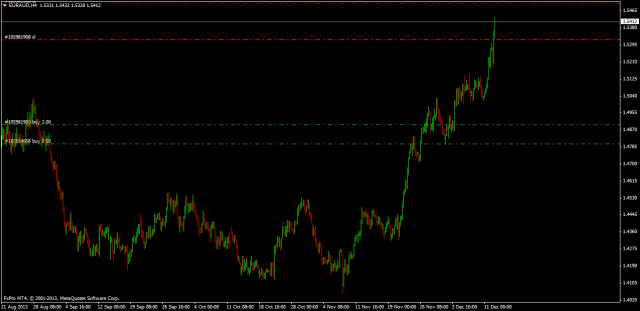
Euro/Aussie – Again a great day. 1.5500 is a great resistance area and an ideal place to get off the train.

euraudh4

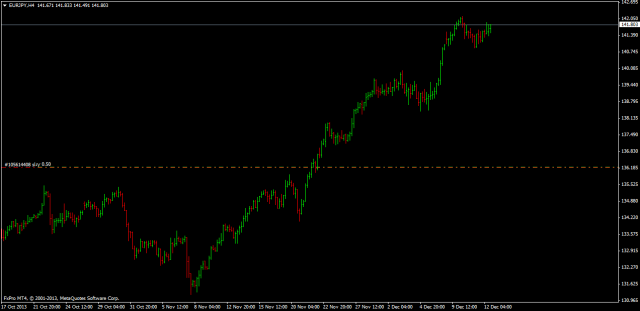
Let the Euro/ Yen run

eurjpyh4

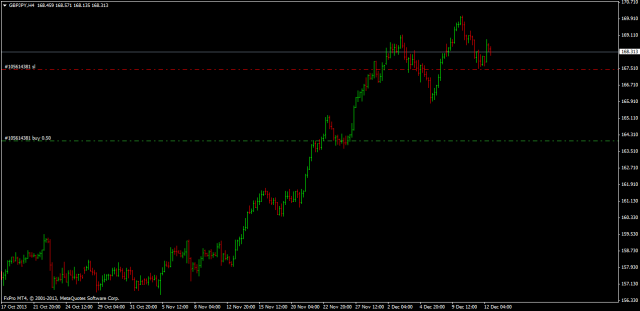
Pound/Yen – Not yet over!

gbpjpyh4

Dear friends,

Below is the link to my latest article on Dukascopy article contest.

To read the full article please click Here .

Always welcome your feedback.


Regards

Raghav


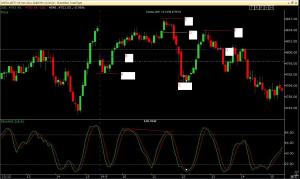
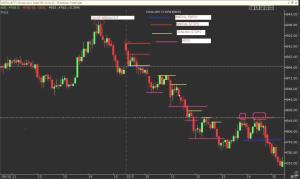
Nifty intraday 5 Min chart

Nifty 5 Min chart

Above is the 5 Min chart…

  1. Entry at B. Stop at A.
  2. Stop and reverse at D. Stop at C.
  3. Exit at E after a wide range bar.
  4. Entry at G and stop at F.
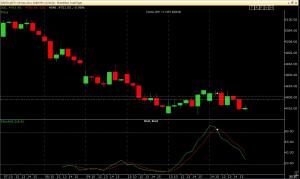
Nifty intraday chart

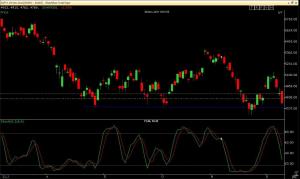
Nifty 60 Min chart

I elaborated on Stoch…. just see how accurately it works…

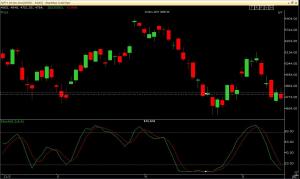
Nifty intraday chart

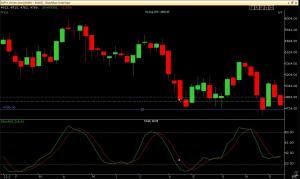
Nifty daily chart

On a daily…. it breaks high of yesterday and then closes in red well below middle of yesterday’s candle…. Means we are looking for more bearish action in the days ahead….

EU false breakout on 5 Min TF

EU false breakout on 5 Min TF

Bala and Praveen……both of you have to put in those extra efforts to ensure that you start catching up with me very quickly…Do go through my thread “My daytrading”  multiple times and then you can come to me with set of questions so that we remain on the same lines…….
Below are my postings on Breakout failure……………….
BREAKOUT FAILURES………………….

Regarding false breakouts….. Why they are so strong and what is the psychological phenomena behind it?A level, say 1000 has been acting as a stiff resistance for a scrip and lot of people watch out for this level…….During the day, say it reaches 995….Now it goes like this.

1. There are a lot of bears sitting at 1000 to sell because they know that’s where the scrip has resistance or in other words last time the price went down when it reached that point.

2. There are bulls ( including amateurs) who want to buy @ 1000 and many have already placed an advance order say just above 1000.

3.There are Big pockets who are ready with small size orders to test who is strong at that resistance level ( testing whether enough bears are there at 1000).

4.Professionals who are just waiting by the side like jackals waiting for either

1.Retest of breakout or
2.Breakout failure.

Now people mentioned in number 3 puts the order through 1000 to test the bears…..Now say it reaches 1110…..all the advance long orders sitting at 1000-1110 gets caught. Amateurs also join the league because they can’t “Miss” something.Now what ? the bears who are sitting at 1000 sell heavily. The price goes down. Now big bulls who have put sample orders come to know that there are enough bears and they keep quiet. Remember bulls have put very small size ( sample like) orders.

Now the people who have gone long on breakout, wait thinking that prices will comeback. To their dismay there is no followup since big bulls have gone quiet.(Price to make higher highs needs volume and follow-up.).Now price keeps on declining and the panic sets in.Go to previous post and see the place marked as no 10 in the chart.Now comes professionals who have been sitting on the banks looking at the ongoing TAMASHA.

Now along with bears, who are selling heavily ,the people who have gone long on breakout upside, also start selling in panic.the velocity of fall in the price increases……….Remember fear is a greater force than greed. Thay’s why false breakouts are powerful in daytrading .They happen every now and then.

Has any book taught this to you?

vice versa for failed breakdown.

Bulls have not lost because of sample orders…..
Bears have made money……
Professionals have made money……
Only amateurs gets beaten up….

Example…..

ICICIBANK Breakout Failure
I. Price goes and reaches previous swing high but says I can’t cross it…….. called as breakout failure…

While analyzing 9th Dec Technicals….. here is what I said……. “Now we had a false breakout and you have to figure it out as it will have its impact on Next week”.

The one who paid attention to the above sentence……. would have got big reward today.

Nifty 5 Min 12th dec

The False breakout reaped the benefits today

Have you guy’s bye hearted my lesson?….. Price  never stops….. it is in continuous motion.. Here is the evidence….. Market gaps up on opening… An opportunity… weak market… then gap up….

An aggressive trader takes entry immediately on opening as S/L is very low… just above False Breakout candle at “A”….

For conservative traders… entry is at C… on break of first swing low of the day….. S/L can be at the high of the day… Then onward, it is one way traffic…

Daily is bearish

Daily is bearish

Daily remains bearish…. 4700 is where nifty got weak support thrice, during recent times. That point is the last hope for bulls and they may try to pull the triggers….

Just keep it for your observation…… breaking of 4700 should be with a bang…..

Weekly supports daily

Weekly supports daily

Weekly and daily agree on a common support level……

Now after few years of experience… what all you need to judge whether the market is strong or not is…… just eyeballing the chart….

Here we go….

People are running around shows great panic

People are running around shows great panic

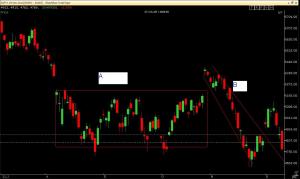
Now look at big circle A….. The starting point is top horizontal line of that box i.e:5200…. The price gaps down and breaks the support of 5300…. people now start panicking and run around for the cover…. This show goes on and on…. all big players try to cover at the possible highest levels which makes it to scale up to 5100 levels. Again there are investors who buy at 4750 with the theory “Buy The Dips”!!!!…….. That box shows unstructured market… Unstructured market always shows weakness…. a structured market has clean and neat swing highs and lows….. now, how the shackles are broken….. It needs a big event….. the event in this case was huge gap up….. That gap up can be described as…. a man of 35 kg lifting the 100 kg weight…. You know the result…….

Have a nice time…..

Please go through my Article……… “De-stressing The Stressful Trader – Tapping Abundant Energy – Part – I” published in Dukascopy Article Contest for the Month of December 2011.

Also, please don’t forget to press the buttons if you like it.

Link to Article

I did not take any trades. Thus once in a while I could stare at charts.

Lets start with 30 Min chart
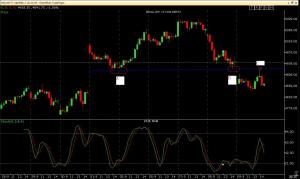
Nifty Chart 30 Min 9th Dec

Homework always gives us resistance and support

On 30 Min chart, I have not expected Gap down as we have +ve divergence. However, no one can predict market with cent percent accuracy. It is adaptability which is key to success in this industry. Once price gaps down, A and B becomes rock solid resistances.

Next once price gaps down it has to either:

  1. Consolidate
  2. Sustain and go down or
  3. Try to fill the gap.

It did the 3rd one.

Now at C the price retested the resistance.

Lets see how it looks on 5 Min chart.
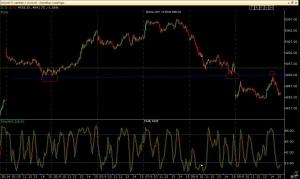
Nifty 5 Min 9th dec res

Resistance is clearly visible.

Lets look at the structure.
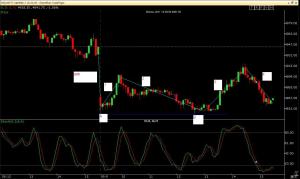
structure on 5 Min 9th Dec

Structure of 5 Min chart

Gaps always spoil the play as we are aware. Reason – the imbalance in supply and demand. In other words the down movements which would have been covered by bars are now avoided by that gap means we have most of the move already covered in gap.

To explain it more better. Say daily range of nifty is 100 points. 4930 to 4870 say 60 point has to be covered by down movements. Now those 60 points are already covered by a gap means we are left with only 40 points to play around!!! Got it? Lets keep things simple…..

A is Low of day (LOD)

Wave 1 has good momentum. However get halted at round number

Wave 2 very sluggish means sellers are not participating. Hence look to get support AT LOD. Exactly the same thing happened. Also see the divergence in Stoch. Remember I told Naveen I guess that there are no AA+ Set ups.

Wave 3 has good momentum and hence goes till our resistance area. Then wave 4 has a structure of a good trending market as it makes swing highs and lows.

Now entry and exits
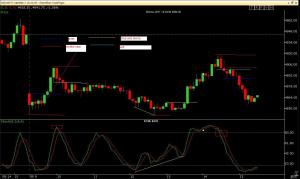
Ideal entry 5 Min 9th dec

We had a false breakout

Self explanatory. Trailing stop is a difficult subject to teach and I will take it separately as we go on. Now we had a false breakout and you have to figure it out as it will have its impact on Next week.

Also note that when market goes to sideways and since hourly and 30 Min stochs take time to go to OB you cane take entries from 5 Min. That is each time Stoch goes to OB short it and make 20-25 points with strict S/L. Just look at today. Also see if you follow rules you cannot make bad trades.

Also you may ask one question. Why do we go short at 4890 despite of stoch in OB>5 bars.

Remember – Price first, Stoch next. Here price made false breakout and then broke previous swing low.

Now the homework for you is to prepare a plan for Monday considering different possibilities and marking support and resistance.

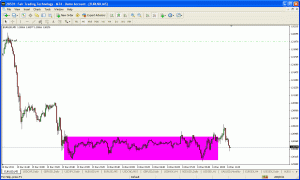
A kickback

AUD/USD Daily chart. After making a strong upmove till 1.03000 price halts and makes a range. Yesterday price breaks upper range at A and then pushed back heavily by bears to end in a shooting star. Now the price breaks low of the range at B and gives me an excellent opportunity to short. My first target is 0.9990.