Archive for December, 2011


ಷೇರು ಮಾರುಕಟ್ಟೆ ಎಂಬ ಸಾಗರದಾಳದಲ್ಲಿ………………………

ಸಂಚಿಕೆ -೧
ಷೇರು ಮಾರುಕಟ್ಟೆ ಎಂಬುದು ಬಂಗಾರದ ಮೊಟ್ಟೆ ಇಡುವ ಕೋಳಿಯೇ? – ಜನಸಾಮಾನ್ಯರ ತಪ್ಪು ಕಲ್ಪನೆಗಳು
————————————————————————————————————-
ಇತ್ತೀಚಿನ ದಿನಗಳಲ್ಲಿ ಷೇರು ಮಾರುಕಟ್ಟೆಯು ತೀವ್ರಗತಿಯ ಕುಸಿತ ಕಾಣುತ್ತಿದ್ದು ಹೆಚ್ಹಿನ ಸಣ್ಣ ಹೂಡಿಕೆದಾರರು ತಮ್ಮ ಹಣವನ್ನು ಕಳೆದುಕೊಂಡಿದ್ದಾರೆ ಹಾಗೂ ಹಣ ಕಳೆದುಕೊಂಡಿರುವವರು ಹತಾಶರಾಗಿ ಷೇರು ಮಾರುಕಟ್ಟೆಯನ್ನು ಶಪಿಸುತ್ತಿರುವುದು ಸಾಮಾನ್ಯವಾದ ದೃಶ್ಯವಾಗಿದೆ.

ಈ ಸಂದರ್ಭದಲ್ಲಿ ಷೇರು ಮಾರುಕಟ್ಟೆಯು ಮತ್ತೆ ಮತ್ತೆ ಏಕೆ ಕುಸಿತ ಕಾಣುತ್ತೆ? ಜನಸಾಮಾನ್ಯರು ಏಕೆ ಹಣ ಕಳೆದುಕೊಳ್ಳುತ್ತಾರೆ? ಷೇರು ಮಾರುಕಟ್ಟೆಯ ವ್ಯವಸ್ಥೆ ಹೇಗೆ ಕೆಲಸ ಮಾಡುತ್ತೆ? ಸಾಮಾನ್ಯ ಜನರು ಷೇರುಮಾರುಕಟ್ಟೆಯಲ್ಲಿ ಲಾಭ ಪಡೆಯುವುದು ಕಷ್ಟ ಸಾಧ್ಯವೇ ? ವಾಣಿಜ್ಯ ವೃತ್ತಪತ್ರಿಕೆಗಳು , ದ್ರಶ್ಯ ಮಾಧ್ಯಮಗಳು , ಬ್ರೋಕರ್ ಗಳು , ಅಪಾರ ಪ್ರಮಾಣದಲ್ಲಿ ಇಂಟರ್ನೆಟ್ ನಲ್ಲಿ ಲಭ್ಯವಿರುವ ಷೇರು ಮಾರುಕಟ್ಟೆ ಕುರಿತ ತಾಣಗಳಲ್ಲಿ ಬರುವ ಅಭಿಪ್ರಾಯಗಳು , ನುರಿತ ತಂತ್ರಜ್ಞರು …………….ಇಷ್ಟು ದೊಡ್ಡ ಗಾತ್ರದ ಸಲಹೆಗಾರರು ಹೆಚ್ಹಿನ ಪ್ರಮಾಣದಲ್ಲಿ ಇರುವಾಗ್ಯೂ, ಒಬ್ಬ ಸಣ್ಣ ಹೂಡಿಕೆದಾರ ಸತತವಾಗಿ ಏಕೆ ಹಣ ಕಳೆದುಕೊಳ್ಳುತ್ತಾನೆ? ಷೇರು ಮಾರುಕಟ್ಟೆ ಏರುಗತಿಯಲ್ಲಿರುವಾಗ ಮಾತ್ರ ಲಾಭಗಳಿಸಬಹುದೇ? ಷೇರು ಮಾರುಕಟ್ಟೆ ಇಳಿಕೆ ಕಾಣುತ್ತಿರುವಾಗ ಲಾಭ ಗಳಿಸುವುದು ಸಾಧ್ಯವಿಲ್ಲವೇ? ಒಬ್ಬ ಸಣ್ಣ ಹೂಡಿಕೆದಾರ ಹೂಡಿಕೆ ಮಾಡಿದ ತಕ್ಷಣ ಮಾರುಕಟ್ಟೆ ಕೆಳಕ್ಕೆ ಬೀಳುವುದೇಕೆ? ಷೇರು ಮಾರುಕಟ್ಟೆ ಎಂದ ತಕ್ಷಣ ಜನ ಭಯಭೀತರಾಗುವುದು ಏತಕ್ಕೆ? ಇವೆಲ್ಲ ಪ್ರಶ್ನೆಗಳು ಜನ
ಸಾಮಾನ್ಯರಲ್ಲಿ ಮೂಡುವುದು ಸಹಜ. ಆದರೆ ಇದಕ್ಕೆ ಸಮರ್ಪಕವಾದ ಉತ್ತರವನ್ನು ಸಾಮಾನ್ಯ ಜನರಿಗೂ ಅರ್ಥವಾಗುವ ರೀತಿಯಲ್ಲಿ ಹೇಳುವವರು ತುಂಬಾ ಕಡಿಮೆ. ಇನ್ನು ಕೆಲವರು ( ಷೇರು ಮಾರುಕಟ್ಟೆಯಲ್ಲಿ ತೊಡಗಿಕೊಂಡಿರುವವರು ) ಇದೊಂದು ರಹಸ್ಯ ಹಾಗೂ ಈ ರಹಸ್ಯವನ್ನು ಜನಸಾಮಾನ್ಯರಿಗೆ ತಿಳಿಸಬಾರದು ಎಂಬ ಅಭಿಪ್ರಾಯ ಹೊಂದಿರುತ್ತಾರೆ.

ಈ ಲೇಖನದ ಮಾಲಿಕೆಯಲ್ಲಿ ಈ ಮೇಲಿನ ಪ್ರಶ್ನೆಗಳನ್ನು ಒಂದೊಂದಾಗಿ ಬಿಡಿಸಿ ಸಮರ್ಪಕ ಉತ್ತರ ನೀಡುವ ಪ್ರಾಮಾಣಿಕ ಪ್ರಯತ್ನ ಮಾಡಿದ್ದೇನೆ . ಅಂದ ಹಾಗೆ ನಾವು ಇಲ್ಲಿ ಕೆಲ ಹೊಸ ವಿಷಯಗಳು, ಅಂದರೆ ಒಬ್ಬ ಸಾಮಾನ್ಯ ಹೂಡಿಕೆದಾರನಿಗೆ ಗೊತ್ತಿರದ ಅಥವಾ ಮುಚ್ಚಿಡಲ್ಪಟ್ಟ , ಆದರೆ ಹೂಡಿಕೆಗೆ ಅತಿ ಅವಶ್ಯಕವಾದ ಕೆಲವು ಸಂಗತಿಗಳ ಬಗ್ಗೆ ಕೂಡ ಚರ್ಚಿಸೋಣ.
ಜೊತೆಗೆ ವೈಜ್ಞಾನಿಕ /ತಾಂತ್ರಿಕ ( Technical Analysis ) ವಿಶ್ಲೇಷಣೆ ಎಂದರೇನು?. ಈ ವಿಶ್ಲೇಷಣೆಯ ಸಹಾಯದಿಂದ ಹೇಗೆ ವಹಿವಾಟುದಾರರು (Trader ‘ s ) ಉತ್ತಮ ಲಾಭ ಗಳಿಸುತ್ತಾರೆ ? ಈ ವಿಷಯಗಳ ಬಗ್ಗೆ ಕೂಡ ಮುಕ್ತವಾಗಿ ಚರ್ಚಿಸೋಣ…

ಅದರ ಜೊತೆಗೆ ಹೂಡಿಕೆದಾರ (Investor) ಎಂದರೆ ಯಾರು? ಹಾಗೂ ವಹಿವಾಟುದಾರ (Trader ) ಎಂದರೆ ಯಾರು? ಇವರಿಬ್ಬರ ಮಧ್ಯೆ ವ್ಯತ್ಯಾಸ ಹಾಗೂ ಇವರಿಬ್ಬರ ಹೂಡಿಕೆಯ ಶೈಲಿ,……………… ಇವರಿಬ್ಬರ ಯೋಚನಾ ಧಾರೆ ಹಾಗೂ ಈ ಯೋಚನಾ ಧಾರೆ ಇವರ ಲಾಭ ಹಾಗೂ ನಷ್ಟಗಳ ಮೇಲೆ ಹೇಗೆ ಪರಿಣಾಮ ಬೀರುತ್ತದೆ ಎಂಬುದನ್ನೂ ಕೂಡ ಸಮರ್ಪಕವಾಗಿ ಚರ್ಚಿಸೋಣ .

ಸಾಮಾನ್ಯವಾಗಿ ಹೆಚ್ಹಿನ ಜನರಲ್ಲಿ ಒಂದು ಭಾವನೆ ಮೊದಲಿನಿಂದಲೂ ಬೆಳೆದು ಬಂದಿದೆ. ಅದೇನೆಂದರೆ ಷೇರು ಮಾರುಕಟ್ಟೆ ಅಂದರೆ ಅದೊಂದು ಜೂಜಿನ ವ್ಯವಸ್ಥೆ ಹಾಗೂ ಅಲ್ಲಿ ಜನಸಾಮಾನ್ಯರು ಹಣವನ್ನು ಭಾರೀ ಪ್ರಮಾಣದಲ್ಲಿ ಕಳೆದುಕೊಳ್ಳುತ್ತಾರೆ. ಇಲ್ಲಿ ಹೋದವರೆಲ್ಲ ಹಣ ಕಳೆದುಕೊಂಡೇ ವಾಪಸ್ ಬರುತ್ತಾರೆ. ಆದ ಕಾರಣ ಷೇರು ಮಾರುಕಟ್ಟೆಯಿಂದ ದೂರವಿರಬೇಕು .
ಇನ್ನೊಂದು ಗುಂಪಿನ ಜನ ( ವಾಣಿಜ್ಯ ವೃತ್ತಪತ್ರಿಕೆಗಳು , ದ್ರಶ್ಯ ಮಾಧ್ಯಮಗಳು , ಬ್ರೋಕರ್ ಗಳು ,ಅಪಾರ ಪ್ರಮಾಣದಲ್ಲಿ ಇಂಟರ್ನೆಟ್ ನಲ್ಲಿ ಲಭ್ಯವಿರುವ ಷೇರು ಮಾರುಕಟ್ಟೆ ಕುರಿತ ತಾಣಗಳಲ್ಲಿ ಬರುವ ಅಭಿಪ್ರಾಯಗಳು , ನುರಿತ ತಂತ್ರಜ್ಞರು ಎನ್ನಿಸಿಕೊಂಡವರು ) ಇದಕ್ಕೆ ವಿರುದ್ಧವಾದ ಅಭಿಪ್ರಾಯ ಹೊಂದಿರುತ್ತಾರೆ. ಇವರಲ್ಲಿ ಹೆಚ್ಚಿನವರು ಹೇಳುವುದು ಏನೆಂದರೆ ಮಾರುಕಟ್ಟೆ ಯಾವತ್ತೂ ಮೇಲಕ್ಕೆ ಏರುತ್ತಲೇ ಇರುತ್ತದೆ. ಹೀಗಾಗಿ, ಮಾರುಕಟ್ಟೆಯು ಪ್ರತಿ ಬಾರಿ ಇಳಿಕೆ ಕಂಡಾಗಲೂ ಖರೀದಿಸಿ!ಖರೀದಿಸಿ! ಖರೀದಿಸಿ!
ಜೊತೆಗೆ ಇವರು ಷೇರು ಮಾರುಕಟ್ಟೆಯಿಂದ ಅಸಾಮಾನ್ಯ ಲಾಭ ( Exraordinay return) ಗಳಿಸಬಹುದೆಂದು ಪ್ರತಿಪಾದಿಸುತ್ತಾರೆ. ಇದಕ್ಕೆ ಸಮರ್ಥನೆ ಎಂಬಂತೆ ಇವರು ಎಷ್ಟೋ ವರ್ಷಗಳ ಹಿಂದಿನ ಅಂಕಿ ಅಂಶಗಳನ್ನು ನಿಮ್ಮ ಮುಂದಿಡುತ್ತಾರೆ. ಈ ಗುಂಪಿನವರು ಇಷ್ಟೆಲ್ಲಾ ಮಾಡುವುದು ತಮ್ಮ ಹೊಟ್ಟೆ ಪಾಡಿಗಾಗಿಯೋ,ಸ್ವಾರ್ಥಕ್ಕಾಗಿಯೋ ಅಥವಾ ಷೇರು ಮಾರುಕಟ್ಟೆಯ ಒಳ ತಂತ್ರಜ್ಞಾನ ( inner mechanism) ದ ತಿಳುವಳಿಕೆ ಇಲ್ಲದಿರುವುದರಿಂದಲೋ …ಯಾವ ಕಾರಣದಿಂದ ಅಂತ ಹೇಳುವುದು ತುಂಬಾ ಕಷ್ಟಕರ. ಜೊತೆಗೆ ಈ ಗುಂಪಿನವರ ಇನ್ನೊಂದು ಘೋಷಣೆ “ಷೇರು ಮಾರುಕಟ್ಟೆ ಯಾವತ್ತೂ ಏರುತ್ತಲೇ ಇರುತ್ತದೆ” ಎನ್ನುವುದನ್ನು ಹೆಚ್ಹಿನ ಸಣ್ಣ ಹೂಡಿಕೆದಾರರು ನಂಬಿ ಹಣ ಹೂಡುತ್ತಾರೆ. ಆದರೆ ಅವರು ಒಂದು ವಿಷಯವನ್ನು ಮರೆತಿರುತ್ತಾರೆ. ಅದೇನೆಂದರೆ ಏರಿಳಿತ ಎನ್ನುವುದು ಪ್ರಕೃತಿಯ ಸಹಜ ನಿಯಮ. ಸಮುದ್ರದ ತೆರೆಗಳು ಸತತವಾಗಿ ಏರಿಳಿತ ಕಂಡರೆ ,ಚಂದ್ರ ಪೂರ್ಣಿಮೆಯಂದು ಏರಿಕೆ ಕಂಡು ಅಮಾವಾಸ್ಯೆಯಂದು ಇಳಿಕೆ ಕಾಣುತ್ತಾನೆ. ಹಾಗೆಯೇ ಗಿಡಮರಗಳು,ಮನುಷ್ಯ, ಪ್ರಾಣಿ ಪಕ್ಷಿಗಳು ಕೂಡ ಸತತವಾಗಿ ಏರಿಳಿತವನ್ನು ಕಾಣುತ್ತಲೇ ಇರುತ್ತವೆ. ದಿನವಿದ್ದಲ್ಲಿ ರಾತ್ರಿ ಇರಲೇ ಬೇಕು. ಹಾಗೆಯೇ ಬೆಳಕು ಇದ್ದ ಮೇಲೆ ಕತ್ತಲೆ ಎನ್ನುವುದೂ ಇರಲೇ ಬೇಕು. ಅದೇ ರೀತಿ ಏರಿಕೆ ಅನ್ನುವುದು ಇದ್ದ ಮೇಲೆ ಇಳಿಕೆ ಅನ್ನುವುದೂ ಕೂಡ ಇರಲೇಬೇಕು. ಈ ನೈಜತೆಯನ್ನು ಅರಿತುಕೊಂಡರೆ ನಮ್ಮ ಹೂಡಿಕೆಯ ಅರ್ಧದಷ್ಟು ಸಮಸ್ಯೆಗಳು ಪರಿಹಾರವಾಗುತ್ತವೆ. ಆದರೆ ದುರದೃಷ್ಟವಶಾತ್ ಷೇರು ಮಾರುಕಟ್ಟೆ ವಿಷಯಕ್ಕೆ ಬಂದಾಗ ಮಾತ್ರ ನಮ್ಮ ಅಪೇಕ್ಷೆ ಬೇರೆಯೇ ಆಗಿದ್ದು , ಷೇರು ಮಾರುಕಟ್ಟೆ ಗಗನದಷ್ಟು ಎತ್ತರಕ್ಕೆ ಏರುತ್ತಲೇ ಇರಬೇಕೆಂದು ಬಯಸುತ್ತೇವೆ.

ವಾಸ್ತವಿಕವಾಗಿ ಷೇರು ಮಾರುಕಟ್ಟೆಯು ಮೊದಲಿನ ಗುಂಪಿನವರು ನಂಬಿದ ತರಹ ಒಂದು ಭೂತವೂ ಅಲ್ಲ ಹಾಗೂ ಎರಡನೆಯ ಗುಂಪಿನವರು ನಂಬಿರುವಂತೆ ಬಂಗಾರದ ಮೊಟ್ಟೆ ಇಡುವ ಕೋಳಿಯೂ ಅಲ್ಲ. ಷೇರು ಮಾರುಕಟ್ಟೆ ಎಂದರೆ ” ಹಂಚಿಕೆ ( supply ) ಹಾಗೂ ಬೇಡಿಕೆ ( demand ) ಗಳನ್ನು ಅವಲಂಬಿಸಿ ನಿಂತಿರುವ ಒಂದು ಅರ್ಥ ವ್ಯವಸ್ಥೆ “. ಆದರೆ ಇತರೆ ಆರ್ಥಿಕ ವ್ಯವಸ್ಥೆಗಳಂತೆ ಷೇರು ಮಾರುಕಟ್ಟೆಯು ಸ್ಪಷ್ಟ ರಚನೆ ( Clear structure) ಹೊಂದಿಲ್ಲ. ಇದೇ ಕಾರಣಕ್ಕಾಗಿ ಹೆಚ್ಹಿನ ಜನಸಾಮಾನ್ಯರು ಅಂದರೆ ಹೆಚ್ಹು ಕಡಿಮೆ ೯೦ ಪ್ರತಿಶತ ಸಣ್ಣ ಹೂಡಿಕೆದಾರರು ಈ ವ್ಯವಸ್ಥೆಯನ್ನು ಯಶಸ್ವಿಯಾಗಿ ಅರಿತು ಹೂಡಿಕೆ ಮಾಡುವಲ್ಲಿ ವಿಫಲರಾಗುತ್ತಾರೆ.ಕಾರಣ ನಷ್ಟವನ್ನು ಅನುಭವಿಸುತ್ತಾರೆ . ಹಾಗೆಯೇ ಈ ವ್ಯವಸ್ಥೆಯ ಒಳ ಹೊರಗುಗಳನ್ನು ( inner mechanism ) ಅನೇಕ ವರ್ಷಗಳ ಪರಿಶ್ರಮದಿಂದ ಅರಿತು ಹೂಡಿಕೆ ಮಾಡುವವರು ಅಪಾರವಾದ ಲಾಭವನ್ನು ಪಡೆಯುತ್ತಾರೆ.

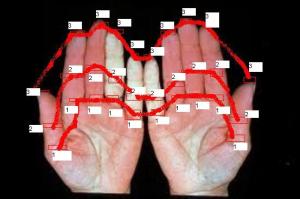
ಷೇರು ಮಾರುಕಟ್ಟೆಯನ್ನು ತುಂಬಾ ಸರಳವಾಗಿ ಅರಿತುಕೊಳ್ಳಬೇಕೆಂದರೆ ಹೀಗೆ ಮಾಡಿ. ನಿಮ್ಮ ಎರಡೂ ಹಸ್ತಗಳನ್ನು ನಿಮಗೆದುರಾಗಿ ಒಂದಕ್ಕೊಂದು ಒತ್ತಿಕೊಂಡಂತೆ ಹಿಡಿದುಕೊಳ್ಳಿ. ಈಗ ಕೆಳಗಿನ ಚಿತ್ರವನ್ನು ಗಮನಿಸಿ. ನಾನು ಬೆರಳಿನ ಕೆಳಗಿನ ಗಂಟುಗಳನ್ನು 1 ಎಂತಲೂ , ಕೆಳಗಿನಿಂದ ಎರಡನೆಯ ಗಂಟುಗಳನ್ನು 2 ಅಂತಲೂ ,ಬೆರಳಿನ ತುದಿಗಳನ್ನು 3 ಅಂತಲೂ ಗುರುತಿಸಿರುತ್ತೇನೆ. ಈಗ ಗಮನಿಸುತ್ತಾ ಬನ್ನಿ . ಎಡಗೈ ಹೆಬ್ಬೆರಳಿನಿಂದ ಆರಂಭವಾಗಿ ಮಧ್ಯದ ಬೆರಳಿನವರೆಗೂ ಕೆಳಗಂಟು,ಮಧ್ಯದ ಗಂಟು ಹಾಗೂ ಮೇಲ್ತುದಿಗಳು ಮೇಲಕ್ಕೆರುತ್ತಿವೆ. ಇದನ್ನೇ ನಾವು ಏರು ಗತಿ (up trend) ಎನ್ನುತ್ತೇವೆ. ಈಗ ಮಧ್ಯದ ಬೆರಳಿನಿಂದ ಕಿರುಬೆರಳಿನವರೆಗೆ ಕೆಳಗಂಟು,ಮಧ್ಯದ ಗಂಟು ಹಾಗೂ ಮೇಲ್ತುದಿಗಳು ಕೆಳಕ್ಕಿಳಿಯುತ್ತಿವೆ. ಇದನ್ನೇ ನಾವು ಇಳಿಕೆ (down trend) ಎನ್ನುತ್ತೇವೆ. ಹಾಗೆಯೇ ಬಲಗೈ ಕೂಡ ಇದೇ ವಿದ್ಯಮಾನವನ್ನು ಸೂಚಿಸುತ್ತಿರುವುದನ್ನು ತಾವು ಇಲ್ಲಿ ಗಮನಿಸಬಹುದು. ಇದು ಒಂದು ಚಕ್ರವಾಗಿದ್ದು ಎರಿಳಿಕೆಗಳು ನಮ್ಮ ಉಸಿರಿನಷ್ಟೇ ಸಹಜವಾಗಿರುತ್ತವೆ.

ನಮ್ಮ ಕೈನಲ್ಲೇ ಷೇರು ಮಾರುಕಟ್ಟೆ

ನಮ್ಮ ಕೈನಲ್ಲೇ ಷೇರು ಮಾರುಕಟ್ಟೆ

ಗ್ಯಾನ್ ( Gann ) ಎಂಬ ಹೂಡಿಕೆದಾರ , ವಾರ್ರೆನ್ನ್ ಬಫೆಟ್ ತರಹ ಈ ಶತಮಾನ ಕಂಡ ಅತಿ ಶ್ರೇಷ್ಠ ಹೂಡಿಕೆದಾರರಲ್ಲಿ ಒಬ್ಬ. ಆತ ೧೯೦೯ ರಷ್ಟು ಹಿಂದೆಯೇ ಹೀಗೆ ಹೇಳಿದ್ದಾನೆ .

” ನನ್ನ್ನ ಜೀವನದ ಕಳೆದ ಹತ್ತು ವರ್ಷಗಳನ್ನು ಸಂಪೂರ್ಣವಾಗಿ ನಾನು ಈ ಮಾರುಕಟ್ಟೆಯ ಒಳ ಹೊರಗುಗಳನ್ನು ತಿಳಿದುಕೊಳ್ಳುವುದಕ್ಕಾಗಿ ಮೀಸಲಿಟ್ಟಿದ್ದೇನೆ. ನಾನೂ ಕೂಡ ಈ ಕ್ಷೇತ್ರಕ್ಕೆ ಬಂದಾಗ ಉಳಿದ ಹೂಡಿಕೆದಾರರಂತೆ ಈ ವಿಷಯದ ಬಗ್ಗೆ ಯಾವುದೇ ಪೂರ್ವ ಜ್ಞಾನವಿಲ್ಲದೇ ಏಳು ಬೀಳುಗಳನ್ನು ಅನುಭವಿಸಿ ,ಸಾವಿರಾರು ಡಾಲರಗಳನ್ನು ಕಳೆದುಕೊಂಡೆ. ನಿಧಾನವಾಗಿ ನನ್ನಲ್ಲಿ ಒಂದು ತಿಳುವಳಿಕೆ ಬರಲಾರಂಭಿಸಿತು. ಅದೇನೆಂದರೆ ……..ಅದು ವೈದ್ಯ ಆಗಿರಬಹುದು,ವಿಜ್ಞಾನಿ ಆಗಿರಬಹುದು ,ಲಾಯರ್ ಆಗಿರಬಹುದು………..ಅವರೆಲ್ಲರೂ ಅವರವರ ಕ್ಷೇತ್ರದ ಬಗ್ಗೆ ಎಷ್ಟೋ ವರ್ಷಗಳ ಸತತ ಪ್ರಯತ್ನ ಹಾಗೂ ಆಳವಾದ ತಿಳುವಳಿಕೆ ಪಡೆದ ನಂತರವೇ ಅವರ ವೃತ್ತಿ ಅವರಿಗೆ ಆದಾಯ ತಂದುಕೊಡಲಾರoಭಿಸುತ್ತದೆ. ಆದರೆ ಷೇರು ಮಾರುಕಟ್ಟೆಯಲ್ಲಿ ಮಾತ್ರ ಒಬ್ಬ ಸಾಮಾನ್ಯ ಮನುಷ್ಯ ಯಾವುದೇ ಜ್ಞಾನವಿಲ್ಲದೇ ಹೂಡಿಕೆ ಮಾಡಿ ಲಾಭ ಗಳಿಸಬೇಕೆನ್ನುವ ಅಪೇಕ್ಷೆ ಹೊಂದಿರುತ್ತಾನೆ ಹಾಗೂ ಆತನ ಅಪೇಕ್ಷೆ ಈಡೇರದೆ ಇದ್ದಾಗ ಬಾಹ್ಯ ವಿಷಯಗಳ ಮೇಲೆ ತನ್ನ ಸೋಲಿನ ತಪ್ಪನ್ನು ಹೊರಿಸುತ್ತಾನೆ. ಈ ಚಕ್ರ ತಿರುಗುತ್ತಲೇ ಇರುತ್ತದೆ. “

ಈ ಮಾತು ನಿಜವೆನ್ನುವುದರಲ್ಲಿ ಎರಡು ಮಾತಿಲ್ಲ. ನಾನು ಸ್ವತಃ ನನ್ನ ಸುತ್ತಮುತ್ತಲಿನಲ್ಲಿ ಇಂತಹ ನೂರಾರು ಜನರನ್ನು ನೋಡಿದ್ದೇನೆ. ಆಶ್ಚರ್ಯವೆಂದರೆ ನಾವು ಒಬ್ಬ ಇಂಜಿನೀಯರ್ ಆಗಿ ಸಂಪಾದನೆ ಮಾಡಬೇಕೆಂದರೆ ೬-೮ ವರ್ಷಗಳ ಪ್ರಯತ್ನ ಬೇಕೇ ಬೇಕು. ಡಾಕ್ಟರನಾಗಿ ಸಂಪಾದನೆ ಮಾಡಲೂ ಕೂಡ ಅಷ್ಟೇ ಸಮಯ ತಗಲುತ್ತದೆ. ಒಬ್ಬ ಲಾಯರ್ ಕೂಡ ೮-೧೦ ವರ್ಷ ಅಥವಾ ಹೆಚ್ಹು ಸಮಯವನ್ನೇ ತೆಗೆದುಕೊಳ್ಳುತ್ತಾನೆ. ಆದರೆ ಅದೇ ವ್ಯಕ್ತಿ ಷೇರು ಮಾರುಕಟ್ಟೆಗೆ ಬಂದಾಗ ಮಾತ್ರ ೨ ತಿಂಗಳಲ್ಲಿ ತಾನು ತೊಡಗಿಸಿದ ಹಣ ದ್ವಿಗುಣವಾಗಬೇಕೆಂದು ಬಯಸುತ್ತಾನೆ. ನಾನು ಕೆಲಸ ಮಾಡುತ್ತಿದ್ದ ಕಂಪನಿಯಲ್ಲಿ ಕೂಡ ಇಂಥಹ ಅಭಿಪ್ರಾಯ ಹೊಂದಿರುವ ಬಹಳ ಜನರನ್ನು ನೋಡಿದ್ದೇನೆ. ಕೆಲವರಿಗೆ ಷೇರು ಮಾರುಕಟ್ಟೆ ಅನ್ನುವುದು ಒಂದು ಮೋಜಿನ ಅಡ್ಡೆಯಾದರೆ ಇನ್ನು ಕೆಲವರಿಗೆ ಅದೊಂದು ಹವ್ಯಾಸ. ಇನ್ನು ಕೆಲವರಿಗೆ ಅದೊಂದು ಕ್ಯಾಸಿನೋ ತರಹ. ಇನ್ನು ಕೆಲವರಿಗೆ ಇದೊಂದು ಟೈಮ್ ಪಾಸ್ ಮಾಡುವಂಥಹ ಒಂದು ಕ್ರೀಡೆ…….ಇದನ್ನೆಲ್ಲಾ ಗಮನಿಸಿದಾಗ ಕೆಲವೊಮ್ಮೆ ನಮ್ಮಲ್ಲಿ ಹಣದ ಬಗ್ಗೆ ಹಾಗೂ ಅದರ ಮೌಲ್ಯದ ಬಗ್ಗೆ……ಎಲ್ಲಿಯೂ ( ನಮ್ಮ ಚಿಕ್ಕ ವಯಸ್ಸಿನಲ್ಲಾಗಲಿ ,ನಮ್ಮ ಶಿಕ್ಷಣ ವ್ಯವಸ್ಥೆಯಲ್ಲಾಗಲಿ ) ಸಮರ್ಪಕ ತಿಳುವಳಿಕೆಯನ್ನು ನೀಡುವ ವ್ಯವಸ್ಥೆಯ ಕೊರತೆ ಇದೆ ಎನ್ನುವುದು ಸ್ಪಷ್ಟವಾಗುತ್ತದೆ.

ಷೇರು ಮಾರುಕಟ್ಟೆ ಏರಿಕೆ ಕಂಡ ದಿವಸ ದೃಶ್ಯ ಮಾಧ್ಯಮಗಳು, ಇಂಟರ್ನೆಟ್ …ಎಲ್ಲೆಲ್ಲಿಯೂ ಷೇರುಮಾರ್ಕೆಟನ್ನು ಅತಿಯಾಗಿ ಪ್ರಶಂಸೆ ಮಾಡಲಾಗುತ್ತದೆ. ಅದೇ ಷೇರು ಮಾರುಕಟ್ಟೆ ೩೦೦ ಅಂಕ ಇಳಿತ ಕಂಡ ದಿನ ತಾವು ಗಮನಿಸಿರಬಹುದು. ಇದೇ ಮೇಲಿನ ಮಾಧ್ಯಮಗಳು…ತಲೆಯ ಮೇಲೆ ಕೈ ಹೊತ್ತು ಅನೇಕ ಕಂಪ್ಯೂಟರ್ ಮಾನಿಟರ್ ಗಳ ( ಟರ್ಮಿನಲ್ ) ಮುಂದೆ ಕುಳಿತ ಒಬ್ಬ ಷೇರು ದಲ್ಲಾಳಿಯ ದೃಶ್ಯವನ್ನು ಚಿತ್ರಿಸುತ್ತವೆ. ಹಾಗಾದರೆ ಷೇರು ಮಾರುಕಟ್ಟೆ ಯಾವತ್ತೂ ಏರುತ್ತಲೇ ಇರುತ್ತದೆಯೇ? ಷೇರು ಮಾರುಕಟ್ಟೆಯಲ್ಲಿ ಇಳಿಕೆ ಎನ್ನುವ ಶಬ್ದಕ್ಕೆ ಆಸ್ಪದವೇ ಇಲ್ಲವೇ? ಅಥವಾ ಷೇರು ಮಾರುಕಟ್ಟೆ ಹಾಗೂ ಏರಿಕೆ ಇವೆರಡು ಅನ್ವರ್ಥ ನಾಮಗಳು ಎಂದು ನಾವು ಕಲ್ಪಿಸಿಕೊಂಡಿರುವ ಒಂದು ಭ್ರಮೆಯೇ?
ಹಾಗಾದರೆ ಈ ಸಮಸ್ಯೆಗೆ ಪರಿಹಾರವಾದರೂ ಏನು?

ಇದಕ್ಕಿರುವ ಪರಿಹಾರವೆಂದರೆ , ಈ ಏರಿಳಿತಗಳನ್ನು ನಿಭಾಯಿಸುವ ಕಲೆಯನ್ನು ರೂಢಿಸಿಕೊಳ್ಳುವುದು. ಅಷ್ಟೇ ಅಲ್ಲ ಏರಿಳಿತ ಎರಡರಲ್ಲೂ ಅಪಾರ ಲಾಭ ಗಳಿಸಲು ಸಾಧ್ಯವಿದೆ ಎನ್ನುವ ಹೆಚ್ಹಿನ ಹೂಡಿಕೆದಾರರಿಗೆ ತಿಳಿದಿರದ ಸತ್ಯವನ್ನು ತಿಳಿದುಕೊಳ್ಳುವುದು ಹಾಗೂ ಏರಿಕೆ ಹಾಗೂ ಇಳಿಕೆ ಎರಡರಲ್ಲೂ ಲಾಭದಾಯಕವಾಗಿ ಹೂಡಿಕೆ ಮಾಡುವ ಕಲೆಯನ್ನು ರೂಢಿಸಿಕೊಳ್ಳುವುದು.

ಈ ಕಲೆಯನ್ನು ರೂಢಿಸಿಕೊಳ್ಳುವುದು ಹೇಗೆಂದು ಮುಂದಿನ ಮಾಲಿಕೆಗಳಲ್ಲಿ ತಿಳಿಯೋಣ. ………….

ಸರ್ವರಿಗೂ ನನ್ನ ಈ ಹೊಸ ಕನ್ನಡ ಅಂಕಣಕ್ಕೆ ಹಾರ್ದಿಕ ಸ್ವಾಗತಗಳು . ಈ ಅಂಕಣದಲ್ಲಿ ಷೇರು ಮಾರುಕಟ್ಟೆ ,ವಿದೇಶೀ ವಿನಿಮಯ ಮಾರುಕಟ್ಟೆ, ತಾಂತ್ರಿಕ ವಿಶ್ಲೇಷಣೆ,ಹೂಡಿಕೆ, ಹೂಡಿಕೆದಾರರ ಮಾನಸಿಕತೆ,ಮಾರುಕಟ್ಟೆ ಕುಸಿತ ಹೀಗೆ ಅನೇಕ ವಿಚಾರಗಳ ಮೇಲೆ ಲೇಖನ ಮಾಲಿಕೆಗಳನ್ನು ಶೀಘ್ರದಲ್ಲಿಯೇ ಆರಂಭಿಸಲಿದ್ದೇವೆ.

ಮತ್ತೊಮ್ಮೆ ತಮ್ಮೆಲ್ಲರಿಗೂ ಸ್ವಾಗತ .ತಮ್ಮ ಅಭಿಪ್ರಾಯಗಳನ್ನು ಬರೆಯಲು ಮರೆಯದಿರಿ.

As far as Technicals are concerned, Nifty made an attempt to cross last week high but failed and now falling back on its own weight. It’s a kind of false breakout again.

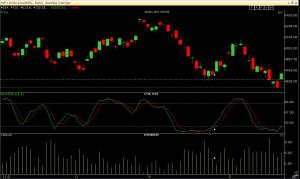
As far as daily chart is concerned, we have again reached overbought zone in no time while before leaving Oversold zone Stoch stayed there for more than 5 bars indicating prevailing bearishness.

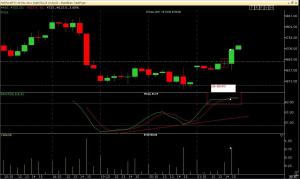
As far as 5 Minutes is concerned, a false breakout trade has become the most popular and we had that twice in last 3 days.

The way in which dollar is bulldozing other currencies, the big bears are thumped up and will be out there with drums and saxophone…..

Dear All,

Hope you had great year-end!!!

I am unable to update the blog on a daily basis as too many things are lined up for me for 2012. To ensure that we are up to date I have decided to update the blog as much as possible on a daily basis. However I may not be able to do my analysis with the charts on daily basis. Whenever possible I will post the charts with my analysis. other days I will be putting my commentary on the technicals which can guide you all to take efficient decisions the next day.

I wish you all a happy and prosperous, healthy and wealthy new year…

We had rally for 2 consecutive days now… Yesterday again we have a AA+ set up..

Nifty 5 Min

Nifty 5 Min chart

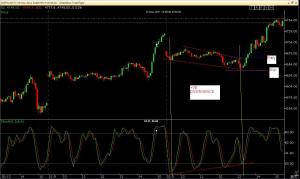
We had an apparent +ve divergence on 5 Min chart and it fetched almost 100 points. Entry and stops are marked in the chart.

Nifty 30 Min

Nifty 30 Min

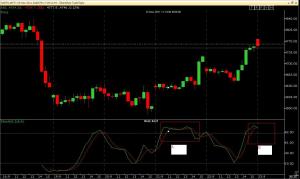
As per the rules… we had a OB> 5 bars. Hence we short only once stoch comes out of OB zone without staying there for more than 5 bars with other conditions getting fulfilled.

Nifty 60 Min

Nifty 60 Min

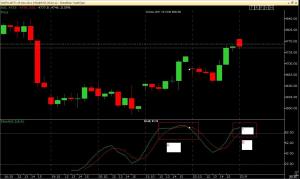
Whatever I have specified above for 30 Min chart applies to 60 Min chart as well.

Nifty daily

Nifty daily

As far daily chart is concerned, just see how stoch spikes up from OS zone just with 2 days of rally indicating that bears are dominant. According to me in majority of the cases the counter trend move do not extend for more than 2 days. Hence I expect a down day today unless bulls have something else in their kitty…

Morning friends….. Hope all of you are experiencing severe cold. Like all of us Market is also experiencing heavy cloud and rain….

I found that lot of you had confusions about how to go about it and take trades. I would like to make the points clear so that the confusion is eliminated.

We have to be aware that day trading and swing trading are entirely 2 different styles of trading. A day traders time frame is just 6-6.5 hours where as a swing traders holding period can be 2 days to few weeks to few months… Hence  a day trader is far-far flexible and needs adjustments on a consistent basis.

A day trader has to take decision very fast. He has to be able to reverse his position in a matter of minutes if the compassion requires him to do so.. Day trading requires immense mental stability… A day trader has to handle his emotions effectively…

See the difference. A swing trader can have only one trend for his particular position. Say he is short for 2 weeks…

However a day trader for example…. can have 4 trends in a single day…. 2 up trends and 2 down trends on 5 Min TF….

That’s why in my TJ “My day trading” thread, I have mentioned that mastering day trading is a really really tough task…

Now… why I have to say this is because during initial stages of one’s trading career, one carries bias…. bias creates opinion and opinion stops you from being flexible…..

Lets see what happened yesterday.

Nifty 5 Min

Nifty 5 Min chart

The year-end is coming. Lot of bulls are still trapped and unable to digest the reality… They gap up… No one can forecast such gap ups… Then just observe what has happened.

Now lets look at combinations of 5 Min, 30 Min and 60 Min chart and just see even on a counter trending day how Technical analysis works to its perfection.

We shall start with 5 Min chart.

Nifty 5 Min chart

Nifty 5 MIn chart

Once price gaps up, we have massive consolidation… An intelligent trader is the one who picks up all the available clues during the consolidation and gets ready with his position to ride the big move in the coming. Here what all clues we get during consolidation.

  1. Stoch makes higher lows..
  2. Stoch stays in OB>5 bars.
  3. Price takes multiple supports at the low of the day.

This massive phenomena is called hidden divergence. I have seen plenty of this instances during the past….

A. Area representing consolidation with low volume.Stoch makes higher lows.

B. OB>5 bars indicating bullish sentiments ahead.

C. Dip in the price and price taking support at the low of the day and then swings back.Also note that when price takes dips to low of day stoch is in OS zone. remember my 2 rules…..

D. A conservative trader takes entry at D on break of high of day and an aggressive trader takes entry at point C itself.

30 minutes and 60 Minutes also indicated bullish moves with high clarity.

Nifty 30 Min

Nifty 30 Min chart

Nifty 60 Min chart

Nifty 60 Min chart

Below is daily chart. Just one day of rally is not enough to reverse the trend. When to say that a trend has shown a signal of reversal?

Answer:

  1. It has to break the trendline.
  2. It has to break the last swing high upside.
Nifty daily

Nifty daily

Here is a column I have written on what is technical analysis and then I also wrote that there is nothing called 100%  guarantee on this universe….

Few days back when I was free and I was going through a thread and saw an opinion from a friend that charts and TA cannot predict the market’s future movement.Hence thought of sharing my view.

TA is like – Clouds have gathered.Sky has become dark.Light breeze.It also started lightening.We say “Its going to rain now”.We pack everything outside and bring them inside the home.We do whatever is needed to face the rain.

Now is it going to rain for sure?We do not know. We also look at circumstances and the time of the year.Here in south India if the clouds gather during June to September time, we say its more likely to rain.Now what does yesterday’s weather report say?it says clouds have covered the sky of south India.More importantly we know the monsoon passes south India during this period.

The clue from weather dept,the time of the year,the dark clouds, lightening,Monsoon all these lead to say that “its going to rain now”.

Now is it going to rain cent percent of the times, when we get all these symptoms?.No. not at at all.May be 2 out of 10 or 3 out of 10 times a strong wind may start and take away the clouds from the sky and it may end up in sunshine.

Now those 7 out of 10 times in which case it rained ,then stats of last 100 years which says Monsoon has entered South India during June-July, The stats which says it recorded 80% of the rain fall from June to Sep , makes us to say that “Its going to rain now”.Its again a psycholgy– For a common man, June -Sep = Monsoon, Cloud, Lightening,Breeze = Rain….

TA works similar way.Its not a pure science.Instead its a applied science,arts,maths and logic.Its job is to compile data and then interpret

1.% OF ODDS IN OUR FAVOUR
2.% OF ODDS AGAINST.

The easiest way of knowing how TA works is to go back and see the old stats.If it works even 40% of the times ,we are winners as our R:R always compensated those 60% odds which is not in our favour in this particular case.

People who want to argue ask”What is the guarantee that Monsoon will arrive this year?”.

The answer to such people is “What is the guarantee that you will get your meals this evening?”

Nifty 5 Min

Nifty 5 Min

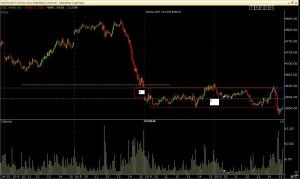
Same old story…… Once upon a time…

Yellow line was a multiple support line.

Box A is a gap down.

Box B is where every one ran for cover (The people who bought at multiple support line thinking it will go up)

Blue box is both breakout failure as well as force of bears….

Hourly

Nifty hourly

On hourly I have put 3 boxes. Come with your homework…

Daily

Nifty daily

On daily we have a bearish engulf……………..

Nifty weekly

Weekly bears

Lets start from weekly. Nifty Breaks long time support zone…

Nifty daily

Daily bears

Daily is a reflection of weekly…. Box A represents the breaking of long time support last time.. at 5300  by gapping down… Today at Box B we have the history repeating itself…

Nifty hourly

Hourly Big red bar was decisive

Few weeks back I wrote that… 4700 will be broken with bang.. did you guys get the message? As I told earlier… at advanced level of trading… One has to grasp the clue and message in each and every word that is written…. Nifty broke 4700 before as well… However, bulls took it upside again as there was no force… Fridays that big red bar on hourly shows bears have come with force…..

Nifty 5 Min

After a huge trending day ,expect a ranging day 90% of the times

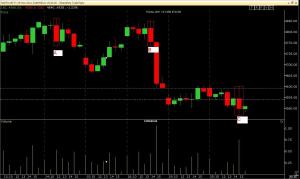
Now, The box I have marked on Friday’s action is a breakout failure. That was the last pullback in this zone by bulls.. Good learning and progress from Bala… After a huge trending day, expect a ranging day in most cases…. Hence one should not have gone for more than 2 trades today… Just one trade… short on break of swing low early in the day.. Then A shows that it do not want to move further down… at B stop gets hit… Should not take anymore trades… Should switch off terminal and enjoy other aspects of life…… Shorting at break of today’s low and keeping the S/L today’s high will be an ideal swing trade going ahead…

Weekly target

3900 is where the gap up is

Few weeks back I forecasted that 3900 is where we are heading… Now the target is not far away…..

Please read my 3rd article on Dukascopy Article contest for Dec 2011…Part-II-De-stressing The Stressfull Trader – Tapping The Abundant Energy.

To read the full article Click here.

Please let me know your opinion by either commenting or rating my article.