Category: 1.Forex Technical Analysis
Friends….
If you master a single pattern.. then… you wait with patience…. you can just make your living..
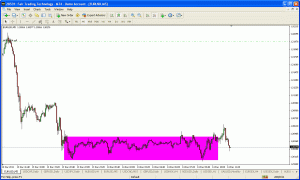
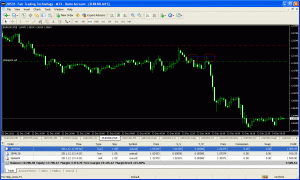
Below is 15 Min EU chart of yesterday… a false breakout and then just see the results in the bottom trade terminal….
Also remember… to learn trading, you have to work and practice consistently… never expect anything easy…. Then you will start reaping the fruits…
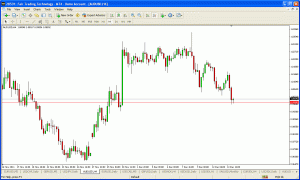
With reference to the analysis I had made on 9th Dec……. we have reached our target of 0.9990 in AUD/USD today…… I always say take AA+ trades….. it will boost your confidence to highest levels……. do you agree with me?
Dollar is just washing out all other cross currencies…!!!
AUD/USD Daily chart. After making a strong upmove till 1.03000 price halts and makes a range. Yesterday price breaks upper range at A and then pushed back heavily by bears to end in a shooting star. Now the price breaks low of the range at B and gives me an excellent opportunity to short. My first target is 0.9990.
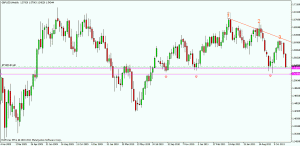
On weekly chart EU made 3 major lower highs .after a steep decline it is nearing a support trendline as well as previous swing low.
The daily chart is in confirmity with weekly suggesting that we have a support at 3150 levels. Once this support is broken we may head to 2900 and then to 2600 which are base point for successive previous rallies.
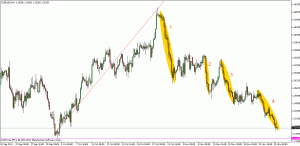
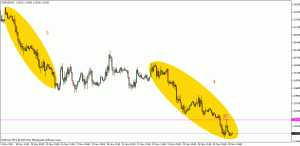
The eclipses marked show the waves of current downmove.aparently we are in a 4th wave. As of yesterday, there was not any sign of reversal on this timeframe too.
A Candle marked in arrow with long upper wick represents successful retest of 3300 levels.
Unless until we have any unusual event, we are heading for 3150 and one should be to happy to book at least major portion of the profit and then wait for either breakdown or reversal and then take the trading decisions accordingly.
Weekly made 1,2,3 lower highs and then the current steep move signals strong downward sentiments. 5430 to 5250 was previous support.
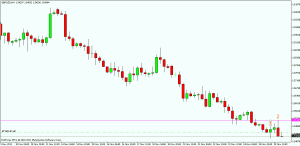
On daily chart the last Fib retracement was deep up to 61.8% .Throughout last week the daily bars never made an attempt to show any upward movements.Consecutive 5 bars in red indicating the depth of the downward movement.
At 5430 levels 4 hour chart made a tiny pin bar indicating a small support ( marked as no 1 ) . However it ended up in a successful retest at 5500 levels resulting in a bearish engulf bar ( Marked as no 2 ).This means we are looking for more downmove.We look for longs only once it breaks the high of this Bearish engulf bar.
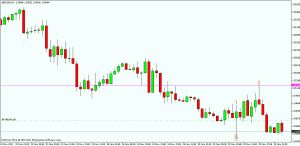
For hourly chart traders ,there was a big pin at 5430 (Marked as No 1 ) The shooting star Marked as No 2) indicates that there is stiff resistance at 5500 and the major even next week will be breaking the low of the Pin bar ( Marked as No 3 ) which is likely to take the price to 5250 levels.

